
The Inside Epidemic? How Has Time Outdoors Changed in 40 Years | USA Blog and News Articles from Iceland | Icewear. https://www.icewear.is/us/blog/time-outdoors-the-inside-epidemic/?srsltid=AfmBOooT9Lcu8roSrASD4F-TPSvvV_zIkLld_uj7pQ1T4AjcWZldH2jr. Accessed 17 Feb. 2025.
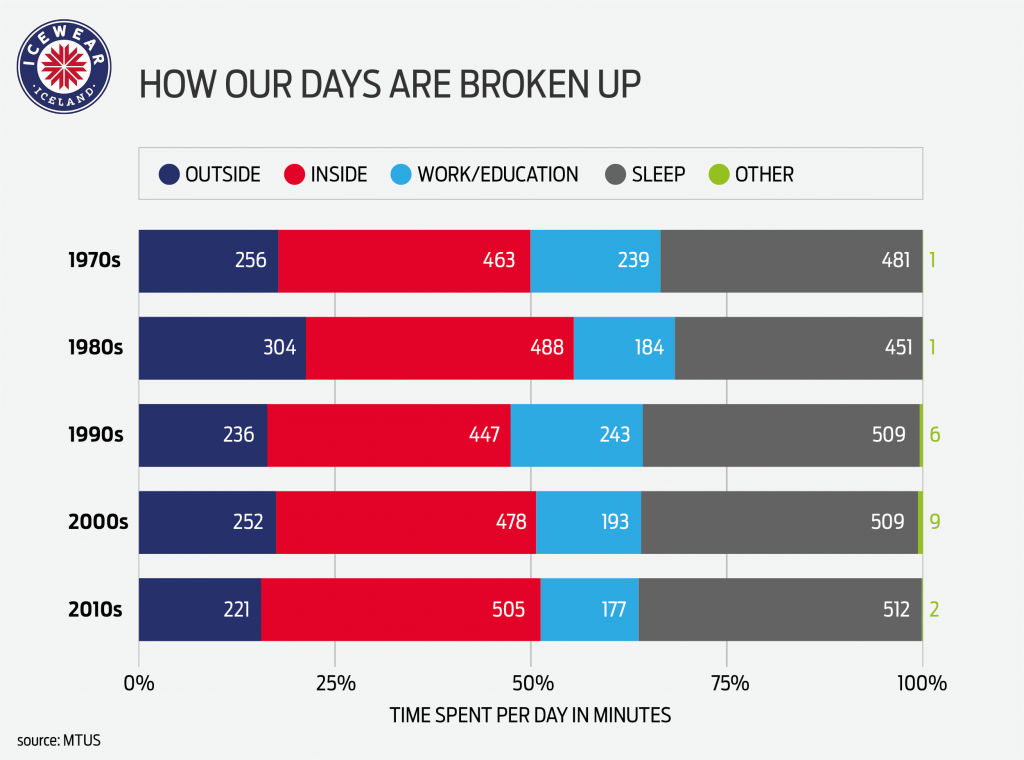
This visualization is trying to convey the time we spend on certain tasks through the decades, specifically how technological innovations may have related to decreases in time spent outside. I think that it is effective at conveying this using the visual of a bar chart, and this style very much suits the data. It is convincing because the visualization is lined up to maximize the convenience of comparing time spent outside so it is very clear there has been an overall decrease. Without the visualization you may still be able to tell with just numbers, but the visualization helps make it clearer. It is possible that pie charts could show this information as well, but this is by far the best option to visualize this data.
The company which I think made and published this data is a winter clothing and bedding brand, so they have ties to wanting people outside. They also have been around a while so they would have seen these trends manifest in their sales through the years. Given these things, the audience I believe is people looking for a reason or a push to get outside so these people will buy gear from the website and get outside. It also means they may be a little biased, because the more convincing their set is, the higher the chance that they will sell things which benefits them further.
The original data is from https://www.timeuse.org/mtus in a raw data format. They cite it at the bottom of the page and in the bottom left corner of each visualization they made. I had some trouble looking into the actual data, but I think it could be used for a multitude of different purposes, it all depends on what specific data on time usage you need. For instance, you could explore specifically outside time decreasing, inside time increasing, time spent sleeping being potentially affected, and more. There are many possible paths to take when studying the time we spend doing things.